
by Konstantin Ogurchenkov
In a recent edition of the Speculator’s Digest, we posted a chart showing US net savings as a share of gross domestic income.
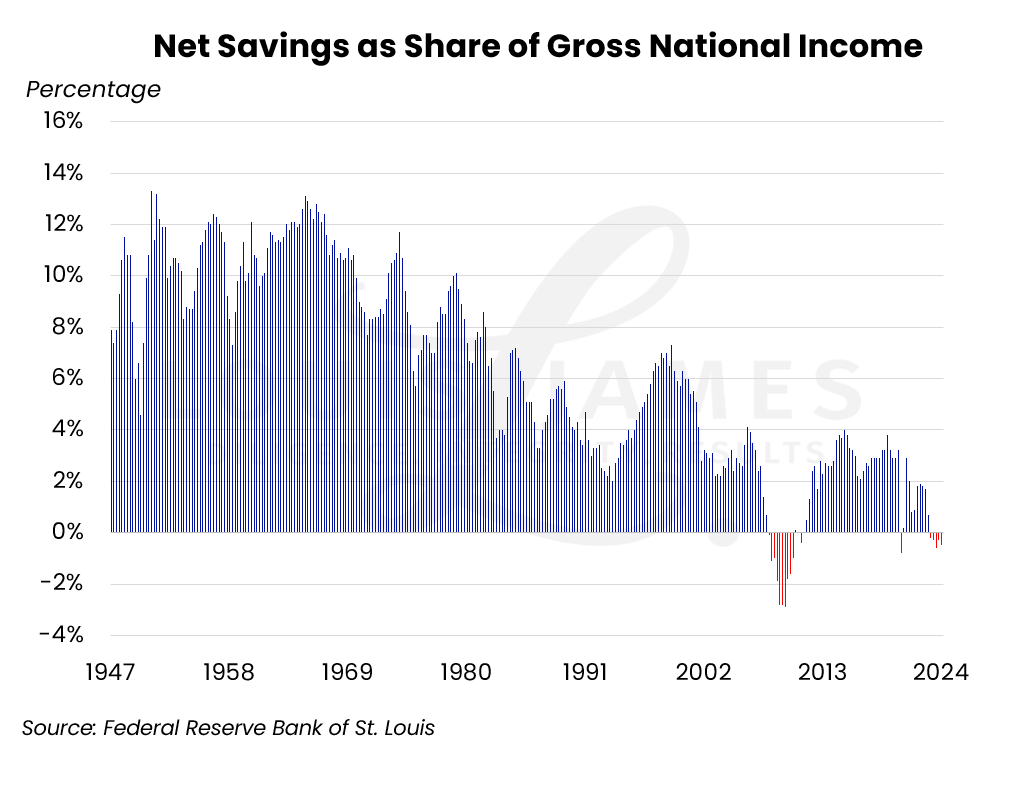
It shows how net savings have related to gross national income since 1947. Important for our purposes, it highlights periods when this ratio went negative:
- During the 2008 Great Financial Crisis.
- Briefly during the COVID-19 lockdown.
- Since the beginning of 2023.
Adding recessions to the chart below (shaded in gray), we can see that most of the drops in the ratio correspond to official recessions:
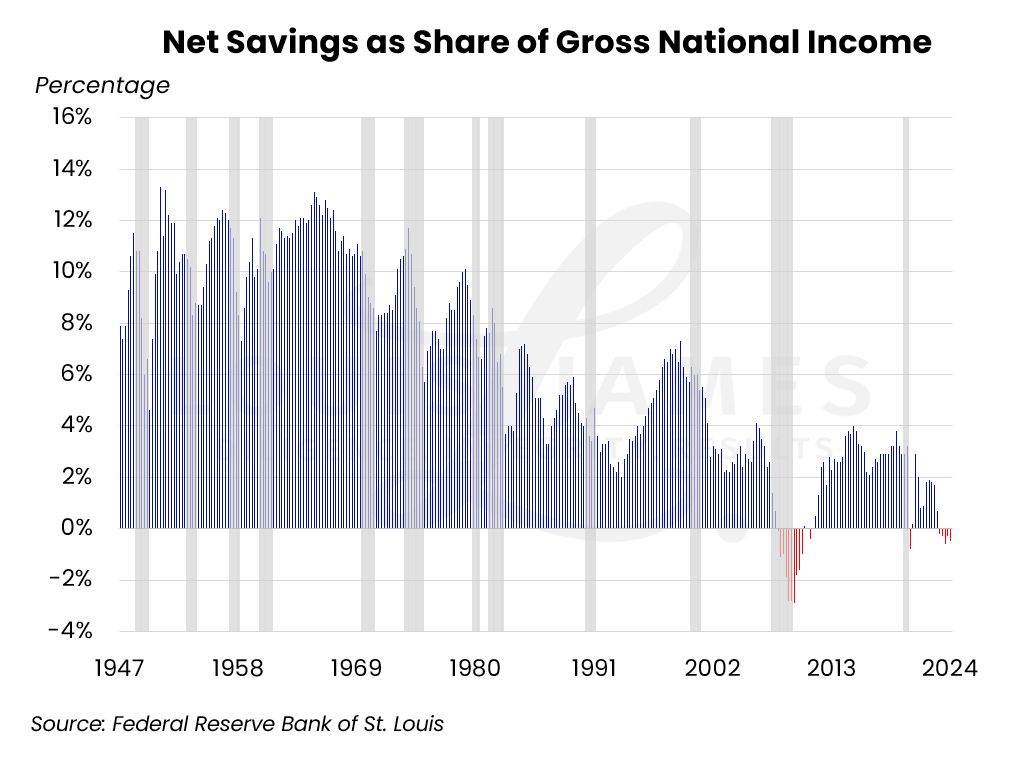
While it’s not a perfect recession indicator, it’s one of many that have already been triggered in the current cycle. Lobo posted a long list in the Digest (email us for a free copy if you missed it).
Shortly after the Digest went live, a reader emailed to say that something was off, because personal savings are low but still positive.
We are always happy to clarify our writing—or correct it if needed. After all, we are all human and can make mistakes.
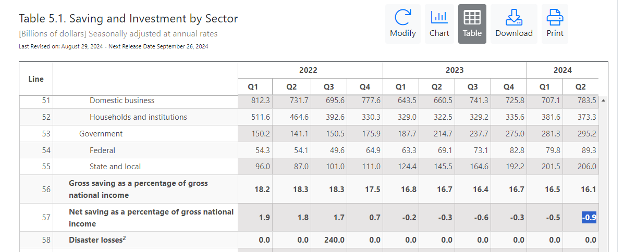
Economic statistics are often confusing, as they can have similar names. In this case, we used to “Net Savings,” which is part of the US Bureau of Economic Analysis (BEA) publication on GDP and personal income. This is found in Table 5.1, Line 57:
At the same time, the BEA also publishes the “Personal Saving Rate,” which is indeed positive, although it’s low. This is exactly as pointed out by our reader:
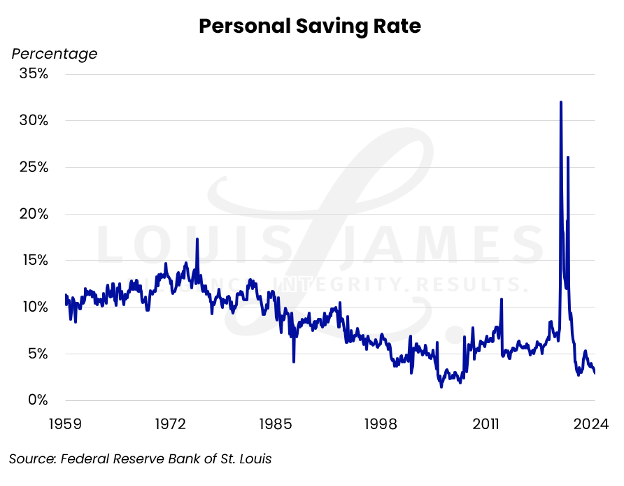
In this dataset, the BEA measures personal savings as a percentage of disposable personal income. These data are also available at the BEA portal, in Table 2.6, Line 35:
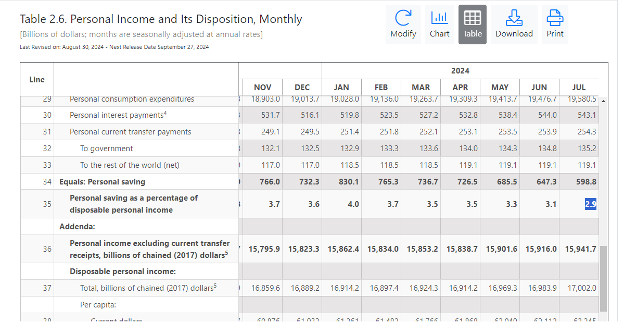
Despite the similar names, “Net Saving Rate” (NSR) and “Personal Saving Rate” (PSR) are calculated from different datasets. The former is a broader measure relating to gross national income, while the latter uses disposable personal income as the denominator. Discrepancies between the two are normal.
We hope that explains the difference between the two datasets.
The Dragging Force ((Or, Who’s to Blame?))
But the discrepancy pointed out by the reader is worth investigating.
The NSR has two major components:
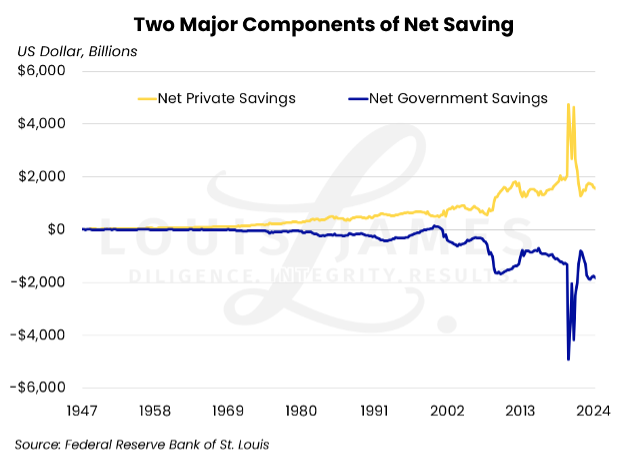
As we can see, Net Private Savings are being dragged down by Net Government Savings (or lack thereof). The state is a kind of nonprofit entity. Its executives care very much about its revenue (taxes) and comparatively little about creating value of any kind.
We’d argue that the results of its “operations” do more harm than good to the economy. Seemingly, every bill out of DC costs billions and creates layers of obstacles that businesses must navigate. And each “inflation reduction act”—or whatever Orwellian name politicians come up with—provides more job security for public employees.
Even if a new measure has a noble cause, such as support during the COVID-19 lockdown, it gets paid for by redistributing taxpayer’s money. That, in turn, creates more expensive problems down the road. Each time, larger volumes of fiat currency flood the economy, leading to devaluation of the currency via inflation (which is not caused by economic growth). Temporary relief measures always lead to more pain down the road.
As you may guess, it only gets worse during presidential elections, when spending goes through the roof.
The point, however, is that even if we take the COVID-19 spikes out of the chart above, government debt (negative savings) is increasing faster than private (actual) savings.
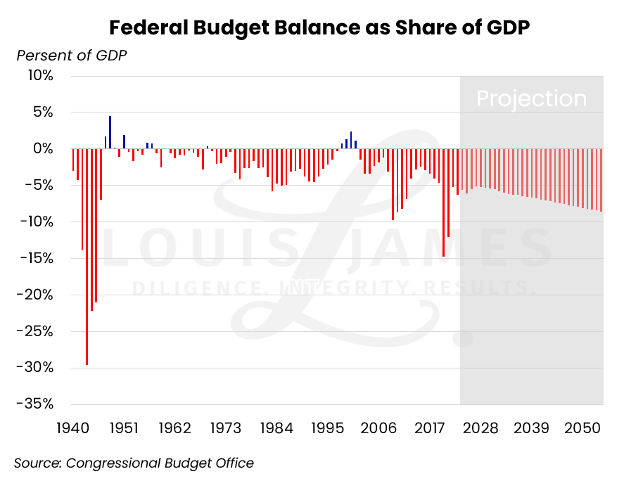
Any regular business with such mismanagement would’ve already gone bust. But politicians have an impressive ability to pretend that nothing is happening. It’s clear from the official federal deficit projections, but no one seems to care.
Any household in financial trouble can either increase its income (like a family where both parents take extra jobs to keep food on the table) or reduce its outlays (like skipping family vacations to preserve funds). But there’s always a problematic member of the family who overspends, no matter how much everyone else is trying to save.
That’s our government: a spoiled child with no respect for family.
Government is like cancer: it exists to grow. In the modern world, the bloat is paid for via inflation and blamed on greedy corporations—or even workers, for asking for higher wages.
Even if state agencies could spend less, they wouldn’t. Any leftovers in the budget mean the agency won’t get more funds in the upcoming year. No bureaucrat wants that, so a deficits and ever-increasing spending are the default settings.
You can pray for a change, but government spending is out of hand, and there is no power to stop this ball from rolling. Hence, our outlook on the economy remains grim.
If we were to evaluate the US economy as a company like we do in our My Take service, it would score a thumbs-down. It has a weak balance sheet, unstable earnings, and an incompetent team running the circus.
At least, that’s what the Net National Savings rate going negative tells us.
KO